Figure An.04 - Anomaly Management Entity Associations

|
Project:
|
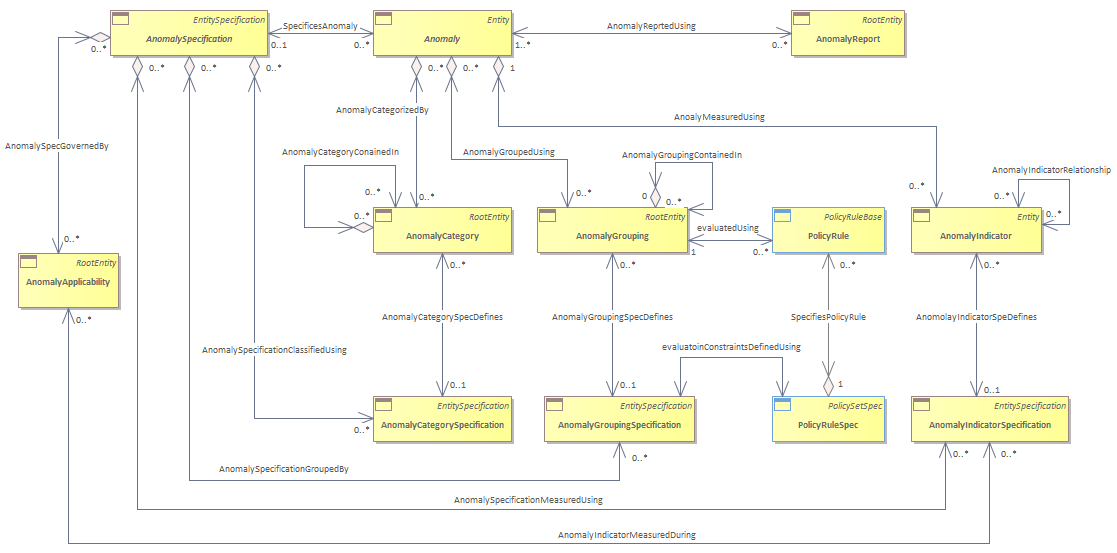
Figure An.04 - Anomaly Management Entity Associations : SID diagram
<font color="#29313b">The following diagram provides various relationships related to the management of anomalies. The characteristics associated with the Anomaly are specified using AnomalySpecifiation. Anomaly can be logically categorized with one or more AnomalyCategory for example System Anomaly, Network Anomaly, Service Anomaly etc, similarly Anomaly can be related to a logical group defined using AnomalyGrouping- for example Anomaly can be grouped based on a logical segment of a network , network function or customer segment. </font><br/><font color="#29313b">Anomaly is measured through a set of indicators which define the metrics being referred to for detecting the anomalies. These indicators, defined through AnomalyIndicator, are associated with Anomaly. These indicators can have associated AnomalyThresholdSet indicating the boundary conditions for the Indicator for the anomaly management to apply constraints and each of the ThresholdSet is associated with set of AnomalyThresholdRule defining the constraint rules. Incase an AI based mechanism is used for managing the Anomaly, the threshold rule and threshold set act like input for AI model to infer the expected anomaly management outcome. Note that in this case the threshold values are just used as reference and not imposed strictly. </font><br/><font color="#29313b">Each of the associated entities of Anomaly are specified using the corresponding Specification , i.e AnomalyCategory-AnomalyCategorySpecification, AnomalyGrouping-AnomalyGroupingSpecification, AnomalyIndicator-AnomalyIndicatorSpecification.</font><br/><font color="#29313b">AnomalySpecification is associated with AnomalyApplicability to describe the conditions and applicability of the Anomaly - for example time of the day, day of the month which may be used by the Anomaly management system to initiate related treatment.</font><br/>
|


