Figure An.14 - Sample Anomaly Business Entities for a RAN Anomaly Management Scenario

|
Project:
|
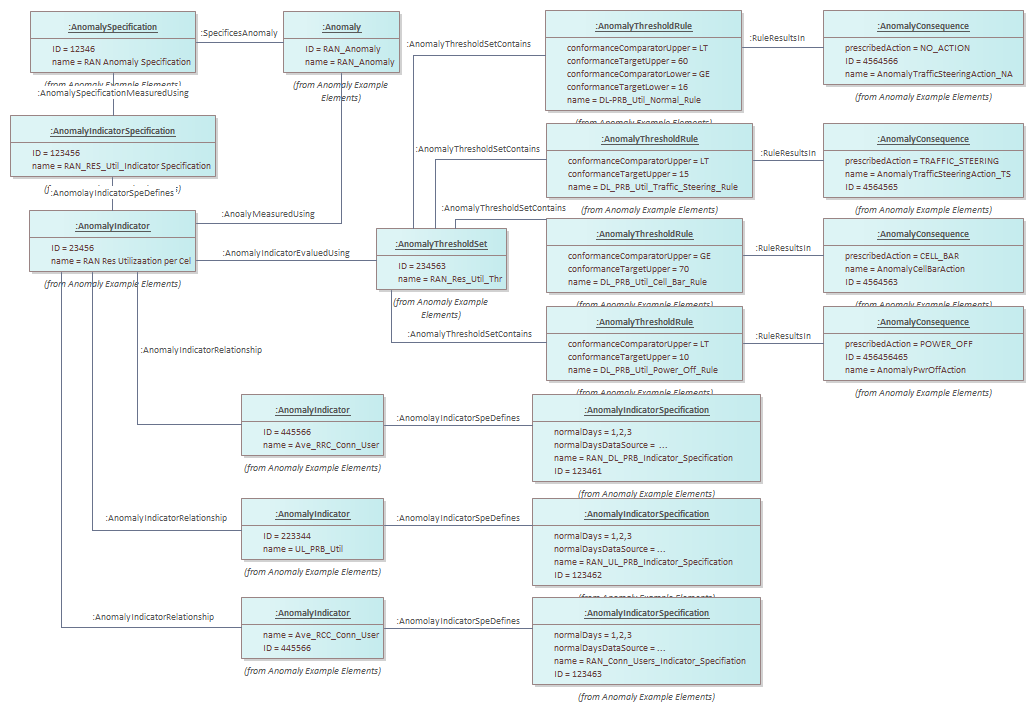
Figure An.14 - Sample Anomaly Business Entities for a RAN Anomaly Management Scenario : Object diagram
The following figure shows the AnomalyIndicator definition for the RAN Anomaly Management scenario. In the case of RAN Anomaly Management, the anomaly is identified by monitoring a set of KPIs associated with RAN. The selection of KPI is use case dependent and may varies across scenarios. For the RAN Anomaly Management , the potential objective assumed is to use it for the energy optimization. With this objective three KPIs are identified - Downlink PRB Utilization per cell, Uplink PRB Utilization per cell and Average RRC Connected users. The DL/UL PRB utilization indicate the amount of radio resources being utilized per cell and the Average RRC Connected users indicate how many active users are utilizing the resources. These KPIs help to determine the load on each cell and how much load can be handed off or balanced across neighboring cells. The KPIs can be collected on a tracking area basis or based on a wider set of cells. Similarly the anomaly can be determined on a per cell basis or a group of cells. It is assumed that the derivationMethod and derivationAlgorithm defined as part of the AnomalyIndicatorSpecification is used to determine the particular calculation logic of the KPIs.<br/>The RAN Anomaly Management uses a nested set of indicators - i.e., RAN Resource Utilization per Cell as a high level indicator and DL/UL PRB Utilization, Average RRC connected users as low level indicators. The nesting helps to also helps in the aggregation scenarios where multiple aggregation logics (such as grouping of cells, KPI family grouping etc.) need to be applied. In the example scenario the low level indicators are consolidated based on a predefined weighted & normalized aggregation logic that gives guidance value for Resource utilization per cell as a percentile value.<br/>A threshold value is assigned at the high level indicator (Resource utilization per cell) which is a guidance value stating the boundary under which the indicator value is deemed to be normal. Each threshold also has a corresponding threshold rule which indicate the logic of calculating the threshold boundaries. In addition to the threshold each of the indicator also has normal days data source and normal days represented as attributes. The objective of normal days data source is to indicate the data repository (such as a file) where the measurements corresponding to indicator are captured in the order of date and time , and normal days are the days within the normal days data which corresponds to the normal value of the indicator. These two parameters are primarily used for training the AI algorithms that monitor the data. These are optional parameters and can be managed as well through the AIModelSpecifications as indicated in TMF915.<br/>The high level indicator also has a set of Consequences which are mitigation actions that might be taken in case the indicator values go beyond the normal values represented through threshold. In the case of RAN Anomaly management it is assumed that an AI ML algorithm is used to determine the right consequence. For example the consequence can be to switch off or switch on a cell or it can be for initiating traffic steering of users to neighbor cells or it can be a sequence of these consequences. In case there is no AI/ML algorithm to decide on the consequences, the selection of the consequences can be based on the threshold rules . For example , there can be set of threshold rules and corresponding consequences - say 0-20%, 20-30%, 30-60% and greater than 60%. So the Anomaly management system can determine the static rules for initiating mitigation action. Additionally, each indicator can also have associated policy (Policy ABE) defined through a policy rule that indicates the criteria for selecting a consequence.<br/>
|


