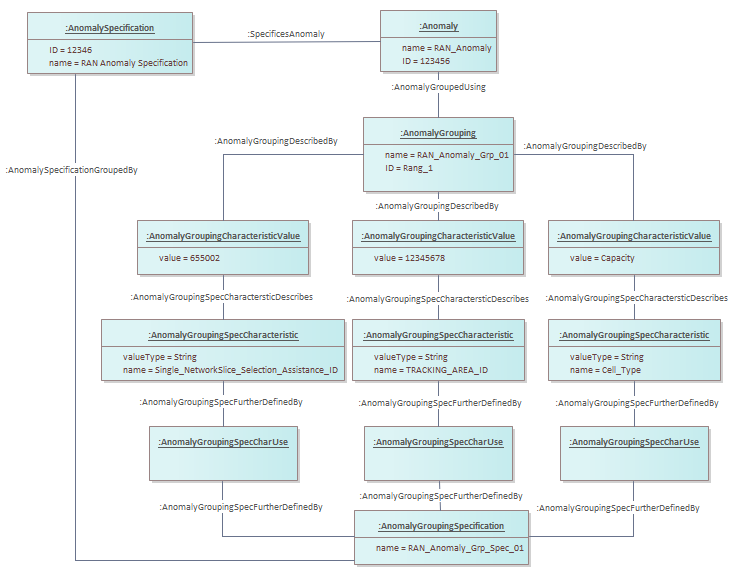
The following figure indicates the grouping criteria of the anomaly. In the case of RAN Anomaly Management, the anomaly can be grouped at different levels of granularity - for example at a slice level, a tracking area where the particular RAN cells belong to, or it can be based on the cell type - i.e., whether it is a Capacity cell or a Coverage cell. The grouping is used for two purposes to align with the KPI granularity - i.e., the grouping of the KPI values and to consolidate anomalies through a logical group to understand the boundary or area of the impact. Based on the grouping criteria the mitigation logic can identify the right action and the extent to which the action need to be applied.<br/>